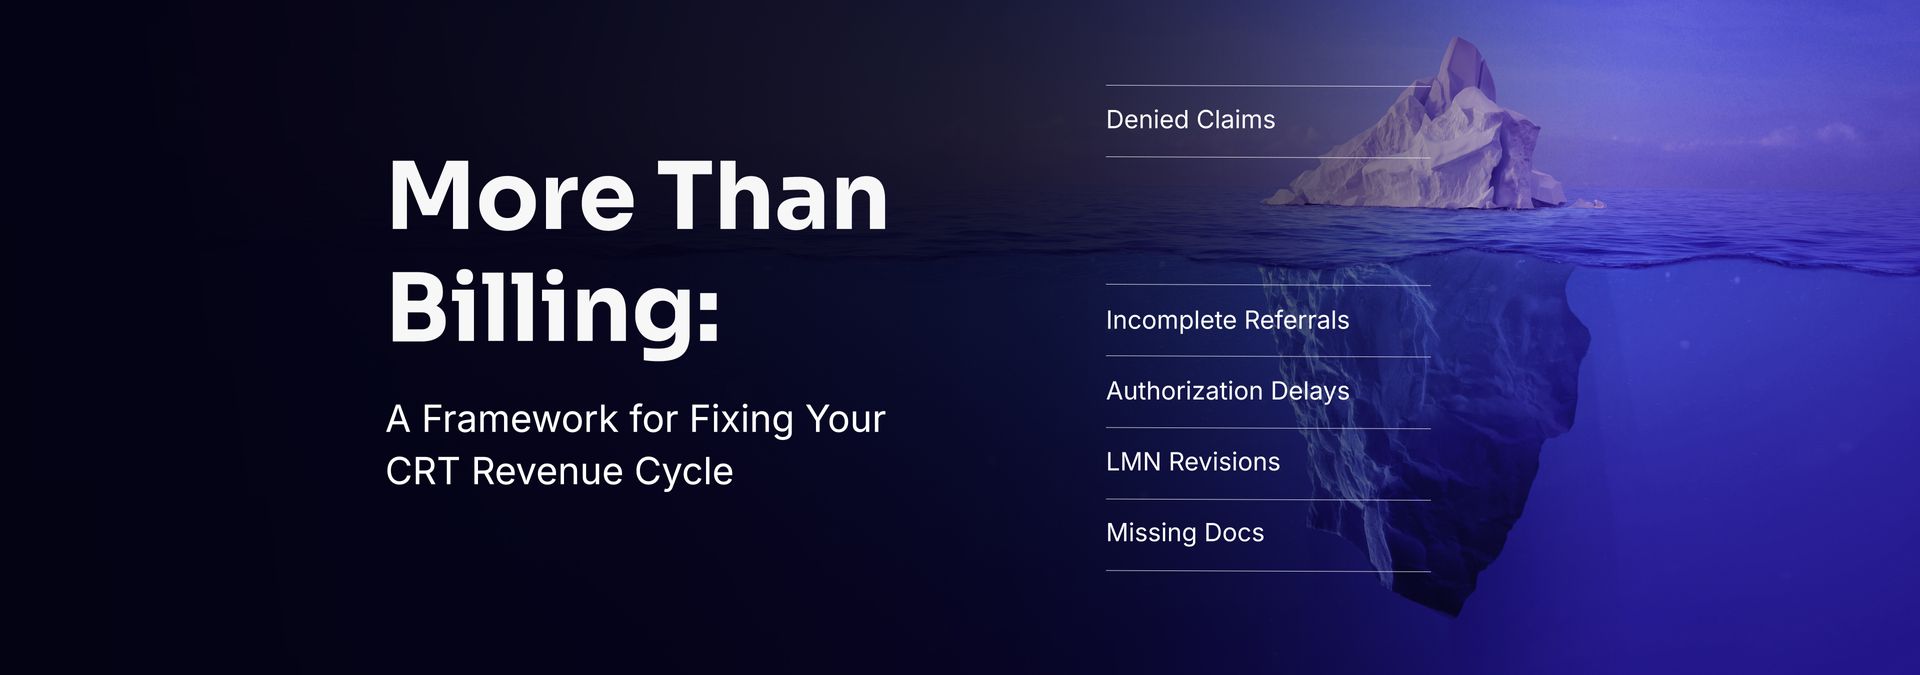
Update: Where Elizur Stands Today

June 16, 2026

Since consolidating onto Nymbl, ēlizur hasn’t just stabilized. They’ve accelerated.


What started as a move to eliminate disconnected systems has evolved into a more coordinated, data-driven operation. Today, their performance reflects that shift.

The ēlizur Story

A high-volume practice driving improvement with Nymbl RCM.

Strong Foundation

By late 2024, ēlizur had stabilized on Nymbl RCM with a 6.4% denial rate. Already well below the 10.4% industry average. Resolution time: 58 days average, closing in on the benchmark for similar-size practices.

Built for Improvement

Through 2025, denial rates dropped another 38%. Claims resolution accelerated 42%, outperforming the benchmark for similar-size practices. Revenue per claim grew +9.4% as the practice shifted toward higher-value cases.

Current State

Q4 2025 denial rate of 4.0% is best-in-class, less than half the industry average and below Nymbl’s own RCM portfolio.

ēlizur was already operating from a strong foundation. With the right system in place, they’ve continued to improve and now perform at a best-in-class level.

Performance Highlights

The impact is clear and measurable. Denial rates are down. Resolution time has accelerated. Revenue per claim has increased. Performance is now outperforming industry benchmarks.

-38%

Denial Rate Drop

6.4% → 4.0%

-42%

Resolution Time

58 → 33 days

+9.4%

Revenue/Claim

Value growth

4.0%
Denial Rate

vs. 10.4% industry

Benchmarked Against the Industry

ēlizur vs 207 O&P practices | Nymbl State of the Industry Report

Metric ēlizur Strategic Cohort Industry Avg. Signal
Denial Rate 4.0% 13.5% 10.4% ★ Best-in-Class
Mean Resolution 33.2 days 46.2 days 43.7 days ★ Exceeds Benchmark
Revenue/Claim Growth +9.4% +11.2% +12.5% ▲ Healthy
Length of Care 76.4 days 76.4 days ~82 days ▲ On Target

Performance stands out when compared directly to industry benchmarks. ēlizur is operating ahead of both strategic cohorts and industry averages across denial rate and resolution time, two of the most critical drivers of cash flow.

Denial Rate: Improvement

Trajectory | Q4 2024 vs Q4 2025

Denial rates have steadily declined over time. This reflects more consistent workflows, faster resolution, and better visibility across the revenue cycle.

Operating at a Higher Level

ēlizur came to Nymbl looking for visibility and control. What they’ve built is a data-driven operation that’s growing with intent, and the results speak for themselves. We’re proud to have them as partners, and excited about what’s ahead. See the full story.

Ready to stop leaving money on the table?

Fill out the form to book time with a member of our team directly.

Turn referrals and documents into patient records with AI-powered intake.

Schedule appointments, deliveries, and technician visits with automated reminders.

Keep orders moving from referral to delivery with configurable workflows.

Send and receive documents instantly with Medsender eFax and e-signatures.

Track purchasing and inventory with clear visibility from order through delivery.

Monitor performance with canned/customizable dashboards and visual analytics.

June 16, 2026
New research finds 1 in 5 O&P clinicians leave the profession within 5.5 years. Here's what the Kistenberg study reveals — and what practice leaders can do about it.
June 9, 2026
Three specific workflow changes that, together, can reclaim 11 to 18 percent of the workday for O&P practices.
June 3, 2026
Digital tools are not the same as digital workflows. Here's why most O&P practices have one without the other — and what it's costing them.