
Watch industry expert Dan Fedor’s forward-looking briefing on the policy shifts, denial trends, and operational risks CRT leaders must prepare for in 2026.

Join Nymbl and Dan Fedor for a CRT webinar on reducing denials, improving billing, and navigating policy changes to strengthen performance in 2026.
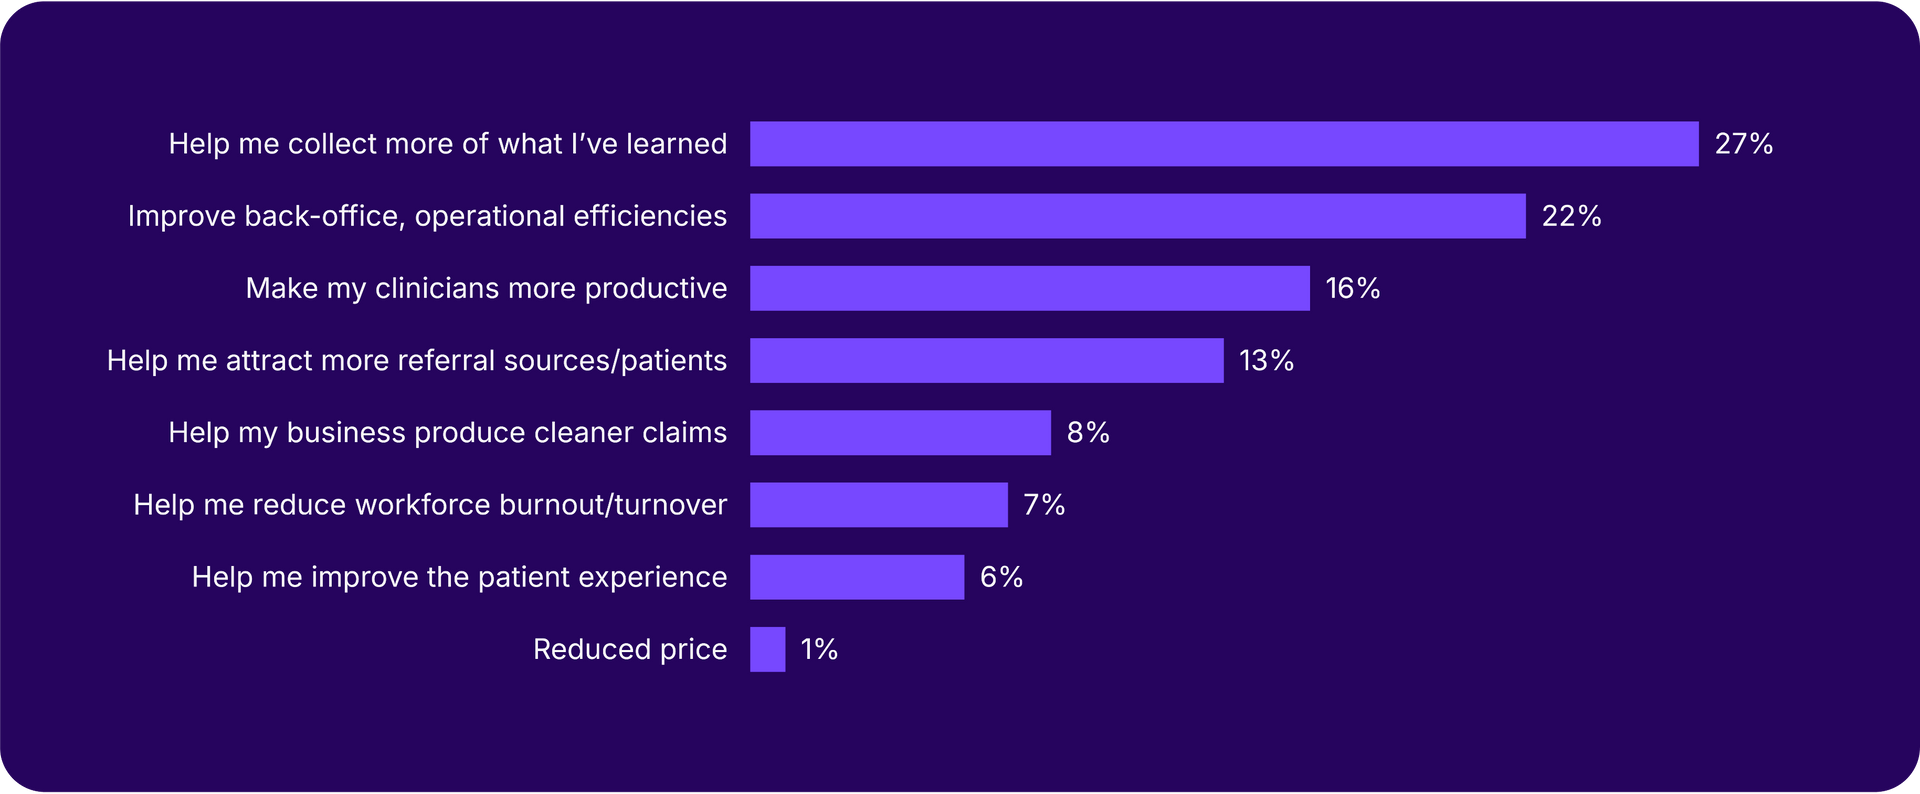
See how your O&P practice compares to 207 others across 8 key metrics and uncover trends, benchmarks, and priorities to guide performance in 2026.